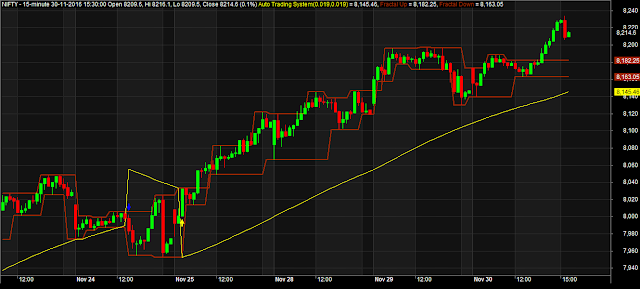
The fractal indicator has been invented and created by the great trader Bill Williams.
Fractals indicator is strongly influenced by chaos theory and mathematics.
1) In chaos theory the market is fractal in nature:
Fractal in nature means that the market makes same/similar movements on all time frames. If you go on to see a chart on different time frames without knowing the time frame, you will not be able to make any difference in the chart patterns, this is what Fractal theory signifies. These recurring patterns might seem to be random, but actually have an order to them, which can be explained by the Elliott Wave Theory.
2) The mathematical definition of a fractal also says something similar:
“Fractals are typically self similar patterns, where self-similar means they are “the same from
near as from far… Fractals may be exactly the same at every scale.” (source: Wikipedia)
Fractals are more powerful on higher time frames and therefore it is better to use them on higher frames. The fractals help to ascertain support and resistance levels. Using Fractals on higher time frames can act a filter for the shorter time charts.
To see the working of the Fractal Trend Indicator Amibroker AFL please click on the image posted below.
Download Fractal Trend Indicator Amibroker AFL
Fractals indicator is strongly influenced by chaos theory and mathematics.
1) In chaos theory the market is fractal in nature:
Fractal in nature means that the market makes same/similar movements on all time frames. If you go on to see a chart on different time frames without knowing the time frame, you will not be able to make any difference in the chart patterns, this is what Fractal theory signifies. These recurring patterns might seem to be random, but actually have an order to them, which can be explained by the Elliott Wave Theory.
2) The mathematical definition of a fractal also says something similar:
“Fractals are typically self similar patterns, where self-similar means they are “the same from
near as from far… Fractals may be exactly the same at every scale.” (source: Wikipedia)
Fractals are more powerful on higher time frames and therefore it is better to use them on higher frames. The fractals help to ascertain support and resistance levels. Using Fractals on higher time frames can act a filter for the shorter time charts.
To see the working of the Fractal Trend Indicator Amibroker AFL please click on the image posted below.
 |
| Fractal Trend Indicator Amibroker AFL |
Download Fractal Trend Indicator Amibroker AFL
No comments:
Post a Comment